Organizing your call analytics in an impactful way that’s also easy to understand is an extensive undertaking even for seasoned marketers. When reporting on lead generation and marketing attribution for your business or a client, the breadth and depth of information at your fingertips can be overwhelming.
Still, understanding the full picture of a campaign’s performance — and using the right tools to strengthen your marketing strategy — is an important part of your job. Studying your data should be an empowering experience, not an unpleasant one.
One of our main missions here at CallRail is to help our users be as confident as possible when they analyzing their reports. Our custom reporting engine (available on the Advanced plan or higher) is a great way to gain clarity when you dig into your data.
Here are a few tips on how to put CallRail’s Custom Reports to work for you.
Save filter sets, save time
Save valuable time, and never worry about recreating a report.
With Custom Reports, you can save filter sets that give you the most insightful discoveries about your data. In addition, you can provide a name for each saved report for easy access later:

Say you’ve found the perfect filters and date range to help tell your campaign’s story — you can preserve those settings for future use, and also have peace of mind that you won’t waste precious time retracing your steps.
Edit table columns for maximum flexibility
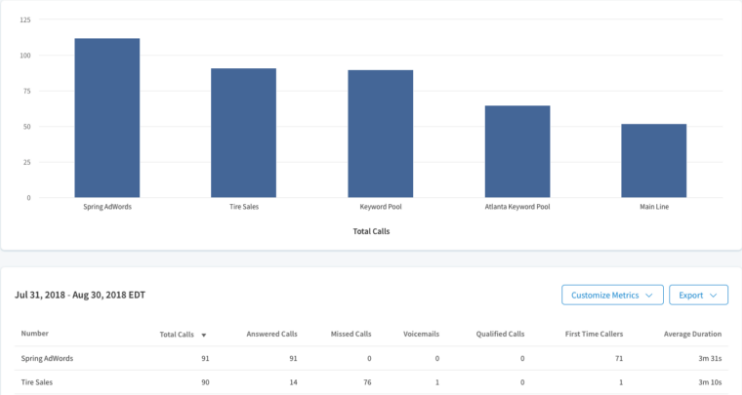
Take full advantage of how your data is presented. Use the ‘Edit Columns’ button within each Custom Report to determine the metrics that appear within the report’s table.
The table will load with a default group of insights, each offering details about your calls and forms. But those items can be changed by checking or unchecking the boxes inside the ‘Edit Columns’ pop-up, giving you a fully customizable reporting experience that puts you in control.
Your data within the selected column items can be exported as an Excel file or saved as a PDF document at any time.
Easily compare data via the Call Log Custom Report
Interested in comparing your call data between date ranges? Enjoy the flexibility available to you in the Call Log Custom Report:

Perhaps you want to compare your call volume over the past week with your volume over a week from a year ago — with a few clicks, that information will be delivered to you, illuminating key lessons about your campaign’s performance.
We’ve made customization easy for you. Choose a date range provided, or create a custom date range that best fits your needs. A chart will appear that breaks down the data between the selected date ranges, and it will include a percentage change for each day or week compared. (Your table will also show a total percentage increase or decrease for your selected date range.)
Go deeper in your custom reporting with call tags
Include call tags in your Custom Reports for deeper knowledge about your numbers, by categorizing your calls with tags that can be created, edited, and color-coded. Using the ‘Edit Columns’ button, feature your tags as a column item in your call reporting.
We recommend creating account-level call tags so you can apply them to each company in your CallRail account. Then, use those tags in your Custom Reports to help sort your data faster and streamline your workflow.

The post An in-depth look at CallRail’s reporting features appeared first on CallRail.